Expected Points table after Gameweek 2: which clubs deserve to be on top?





Which clubs are on top on the basis of the statistics, and which clubs seem to be riding a wave of luck currently?
That question is answered through an expected points methodology calculated with the ECL Supercomputer, using the data accumulated over the two gameweeks to make preliminary judgements about which clubs are overperforming and underperforming.
These tables shed perspective on who is deservedly on top and at the bottom, and who may be frauding themselves into their current position.
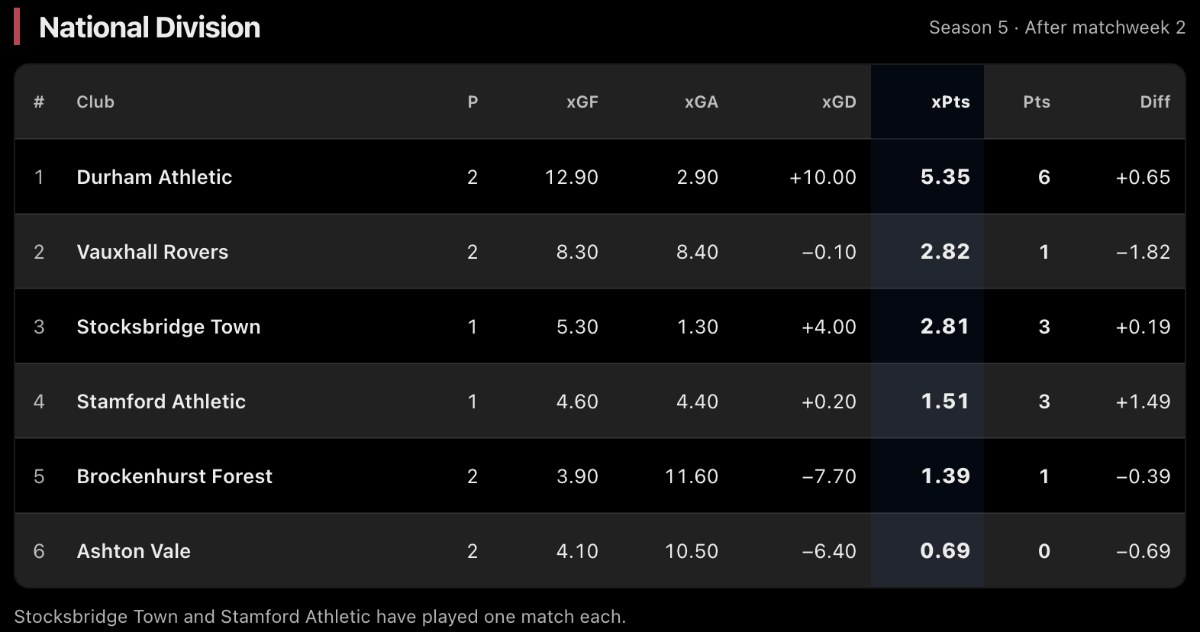
Durham Athletic are deservedly on top in the National Division according to the expected point methodology: but what about Vauxhall Rovers, who came away with a shocking draw against Brockenhurst Forest? According to their expected points, they should have been much higher in second place instead of their current fourth place ranking.
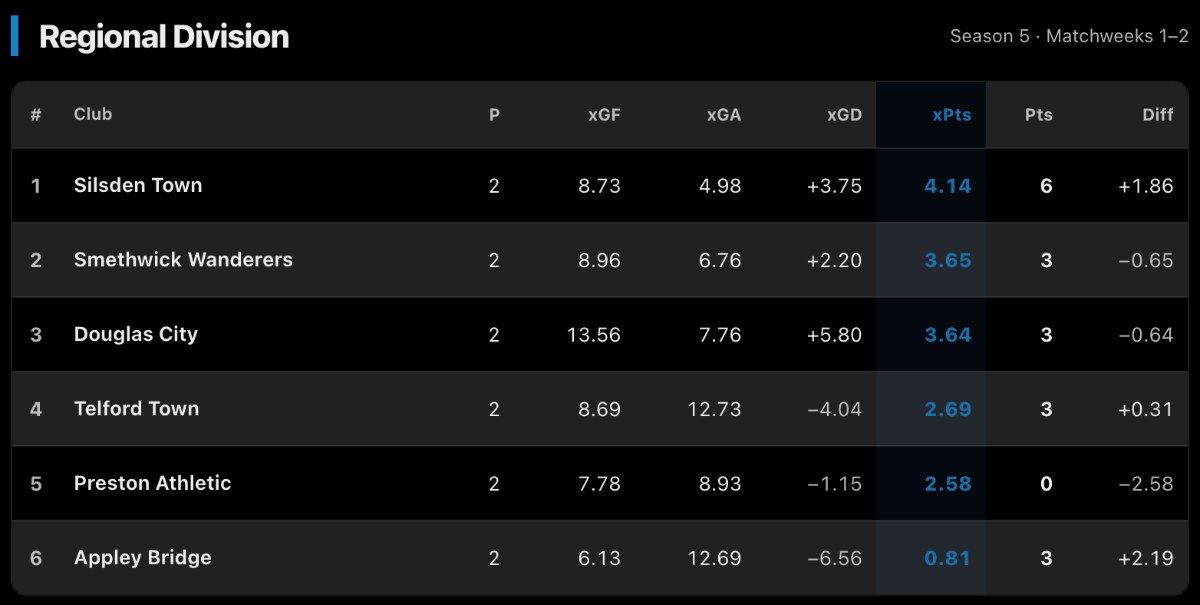
In the Regional Division, Silsden Town sit in the lead, with Smethwick Wanderers following closely. Preston Athletic will have less reason to panic given their large difference between expected points and points: according to the quality of chances they create per game, they will soon have something to celebrate about soon. Yet, models are not equal to truth: are the models missing something structurally wrong with Preston Athletic?
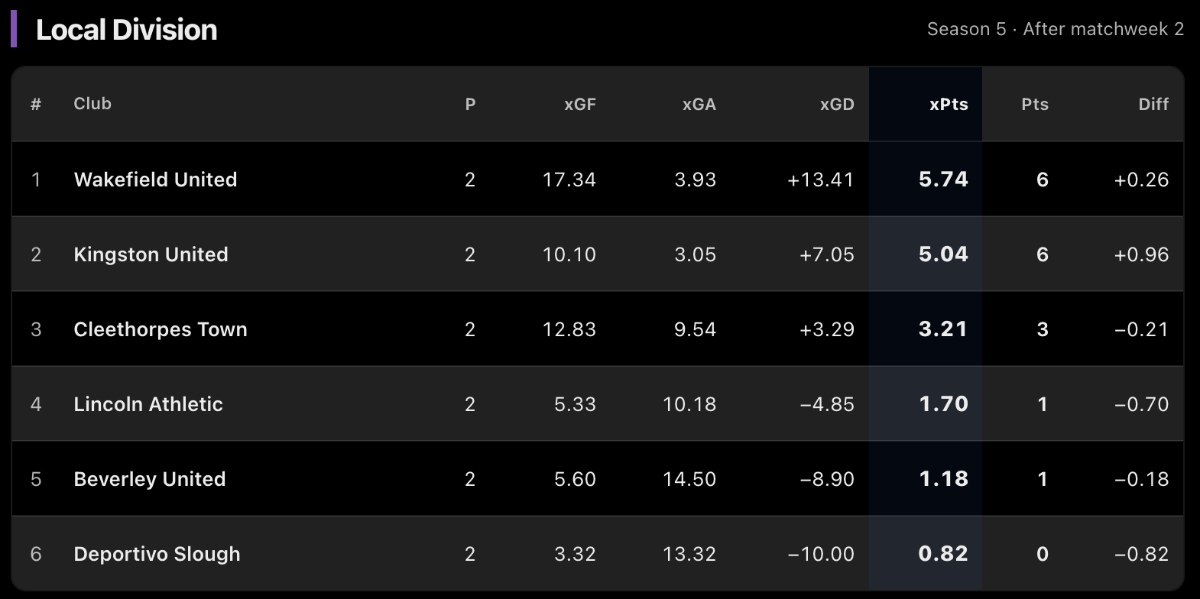
The Local Division offers little spectacle: the two teams on top are deservedly on top. The division is much more well-behaved than other divisions after Gameweek 2. Will one team be capable of breaking through the statistical model? Is the expected points methodology only suited for blowout games like those commonly seen in the Local Division? Only time will tell.